

Google Analytics is an essential tool for results-driven marketers to track their website performance.
Our team has assembled some simple instructions on how to set it up along with their best Google Analytics tips on how to read the data.
This guide includes:
-How to set up Google Analytics
-How to read your Google Analytics reports
-

Learn more about your audience
-
Detect which areas need improvement
-
Move customers along the journey more effectively


CUSTOMER JOURNEY TEMPLATES
Download the TemplatesLet’s start with the benefits of Google Analytics.
Benefits of Google Analytics
Google Analytics is important for the same reason as any marketing analytics — to know what’s working and what isn’t.
With Google Analytics, you can monitor the effectiveness of your online marketing strategies, on-site content, user experience, and device functionality, all under the same roof. For free!
Google Analytics can improve your marketing strategies and help your business grow in many ways. Some of the benefits of Google Analytics include:
- Learn more about your buyer personas and their behavior
- Enhance user experience
- Improve customer journey
- Detect problems and weaknesses
- Know what is performing well and replicate the success
The bottom line is, every successful marketer needs analytics. Without measurable results, you can’t make informed decisions. And without informed decisions, you can’t improve your marketing strategies to achieve your business goals.
How to set up Google Analytics
You can set up Google Analytics in a few simple steps: Log into your Google Account, sign up with Google Analytics, and set up the tracking code.
However, even though the setup is quite intuitive, it’s crucial to do it properly. Poor implementation of Google Analytics will lead to inaccurate results and poor marketing decisions.
Therefore, follow these steps closely and make sure you don’t have any Ad Blockers that may interfere with your GA data.
1. Sign up with Google Analytics

To create your account, just log into your Google account and go to Google Analytics homepage. You can sign up by clicking “start measuring” and follow the steps.
Fill in basic details and decide what you want to measure (app or a website). Once the account has been created, GA will provide you an individual tracking code. It should look something like this: UA-1234555-1.
2. Set up the tracking code
Now you need to add the tracking code on your website.
Many CMS platforms like WordPress have a Google Analytics plugin that will add the code automatically. If you’re coding yourself, however, you’ll need to add the tracking code right after the < head > tag of your header file on every page.
Make sure you don’t accidentally add the code multiple times or track websites built on JavaScript frameworks with default settings.
Once your tracking code is successfully added, your account is ready and starts collecting data.
3. Set goals
Setting goals is not an obligatory step, but it’s highly recommended. With goals, you can get much more insights into your marketing success.
You can set a new goal by clicking “admin” on the bottom left, “Goals”, and then “New goal”.

Goals are meant to track important events on your website such as completed purchases, made appointments, newsletter signups etc.

Goals such as completing a purchase or booking an appointment are easy to set up. All you need is to start tracking the destination URL (usually looks something like www.example.com/thank-you or /thanks).
But if you want to track something more specific like if the user played a video, or clicked a specific button, you need to set up event goals.
4. Set up event tracking
Event tracking is a bit more complex to set up, but definitely worth the trouble. It collects valuable information about actions on your website such as video views, button clicks, and downloads.
This helps you understand the customer journey better and optimize your website for conversions.
You can set events as goals or track them separately. To do this, you need to either set up Google Tag Manager or do it manually.
If you don’t have much previous coding experience, Google Tag Manager is easier to get started with. Here’s a simple guide on how to set it up and create a tag.
PRO TIP: Keep in mind that any event measurement that automatically triggers on the page load will affect your bounce rate. It will appear as 0% even though the user would bounce off your page.
Once you’ve successfully set up event tracking, the data will be found in your Google Analytics under Behavior -> Events.
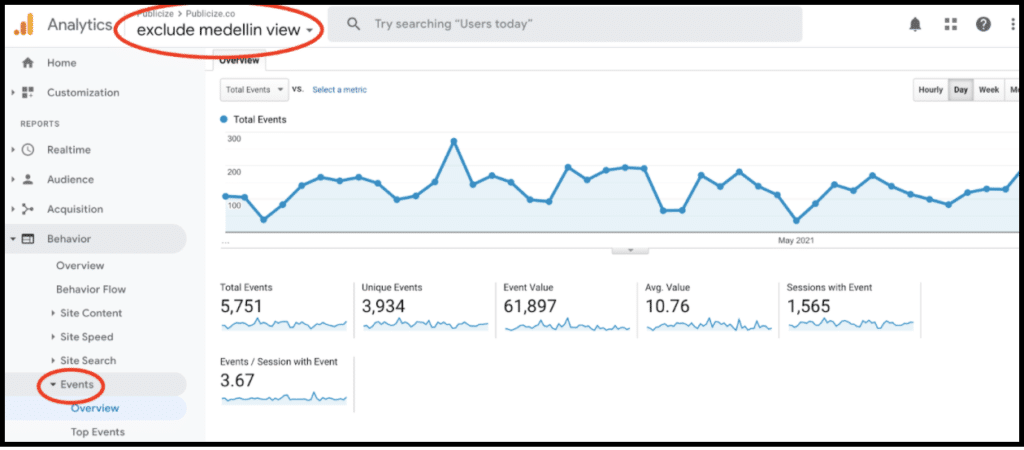
PRO TIP: Always filter out your own company traffic in order to avoid skewed data. You can exclude your company’s IP address or a whole location if it’s not where your audience is at.
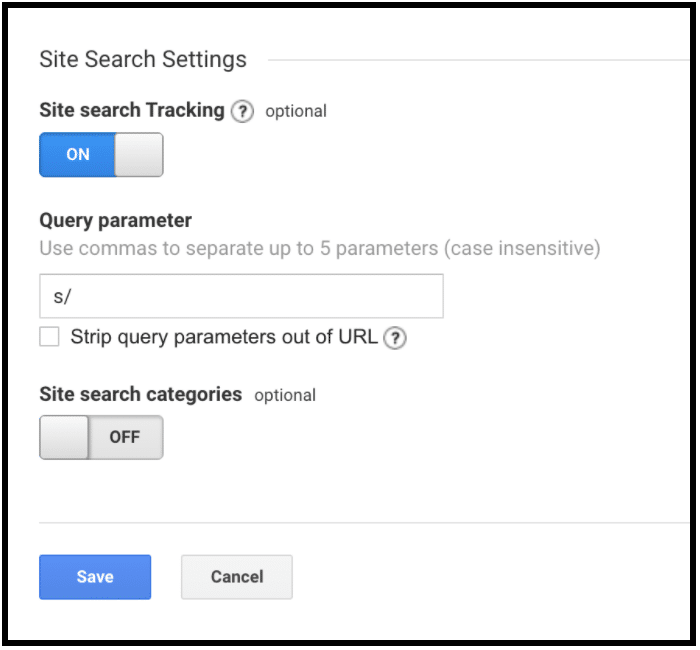
5. Set up site search
Site search is another feature that can provide you valuable information and it’s simple to set up.
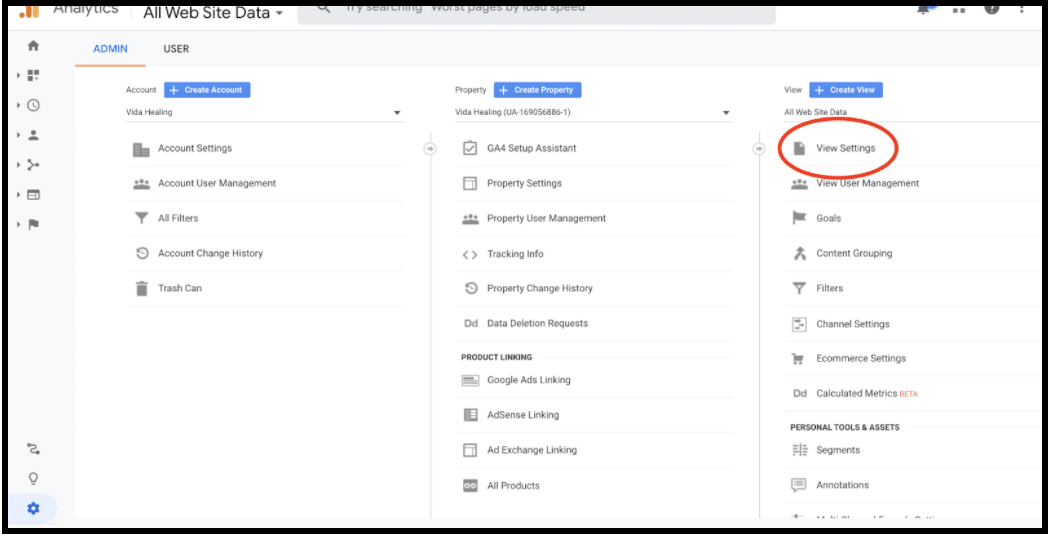
Click Admin -> View settings and then set the site search tracking on.
In order to find the query parameter, you need to open another tab, do a search on your website and check the URL for the parameter.
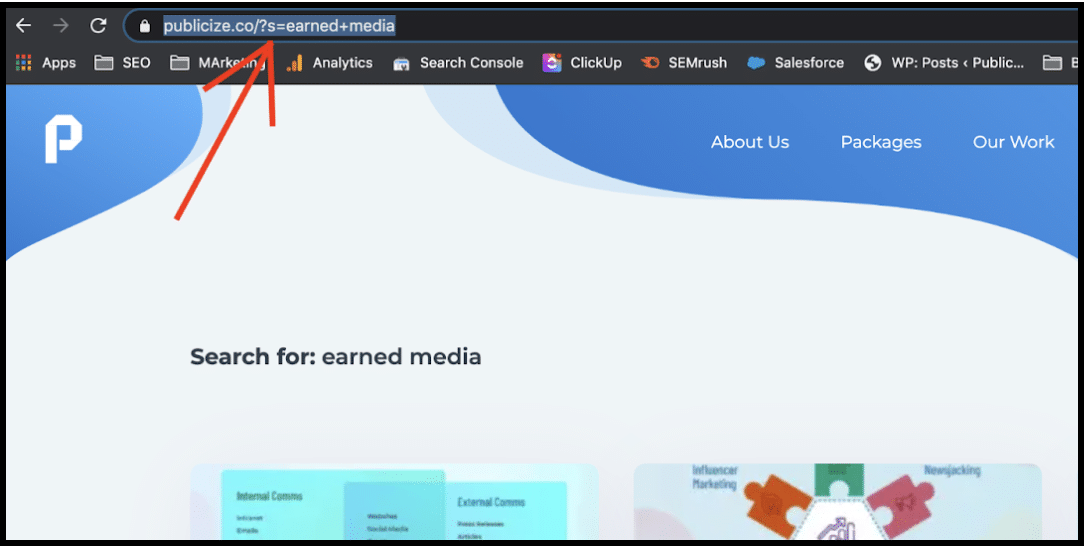
As you can see our parameter is s (Q and s are the most common).
By setting this up, you’ll be able to collect valuable insights on what people are searching on your site and get ideas to create content around it.
Once this is set, your Google Analytics is ready to go and you can start analyzing the data.
Let’s go over the basic reports and how to read your Google Analytics.
How to read your Google Analytics reports
The main reports of Google analytics are audience, behavior, acquisition and conversions. All of these provide you valuable information as long as you know what you’re looking at and why.
Tracking the data and not knowing what it means or not doing anything with the insights is as useful as not tracking at all.
Google Analytics Audience Report
The Audience report is where you learn more about your site’s users. It allows you to dig deeper into demographics, devices and user loyalty.
Geolocation is one of the most useful reports. It can show you potential new markets based on new website traffic by filtering “new sessions” or identify potential opportunities for lucrative ad campaigns by looking at locations with high number of conversions but low traffic.
Device reports on the other hand can reveal some important technical issues. If you see a high bounce rate on a certain browser or device, it might indicate that your site needs better optimization for that specific technology.
Tracking new vs returning visitors is also very useful for monitoring the audience loyalty. Analyzing the correlation between these results and your current marketing efforts can tell how many prospects are truly interested in your content, products or mission.
Many of these audience insights are very useful, but some need to be taken with a pinch of salt. For example, demographics and interests are just based on just estimates, and shouldn’t be the sole metric for making big decisions.
While these may not be 100% accurate, these insights can be still useful nevertheless.
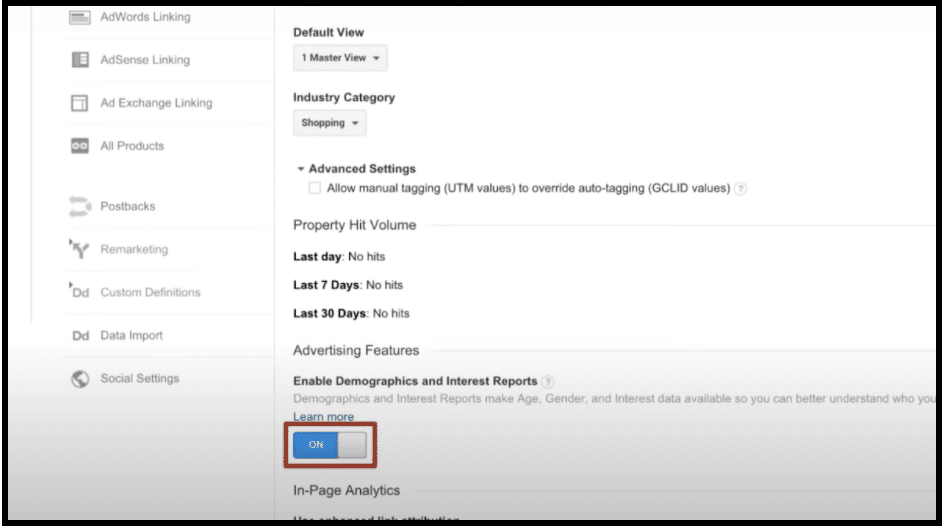
To start collecting the demographics and interests data, you need to have your Google Ads account linked to your Google Analytics and the advertising features enabled. You can do this by clicking “admin” -> “property settings” -> set “Enable Demographics and Interest reports” to on.
Google Analytics Acquisition Report
Acquisition report tells you how users found your website. This gives you insights on which marketing channels are bringing most and the highest quality traffic to your site and where to focus your marketing efforts.
To find out where the most traffic comes from is easy. But how to evaluate the traffic quality?
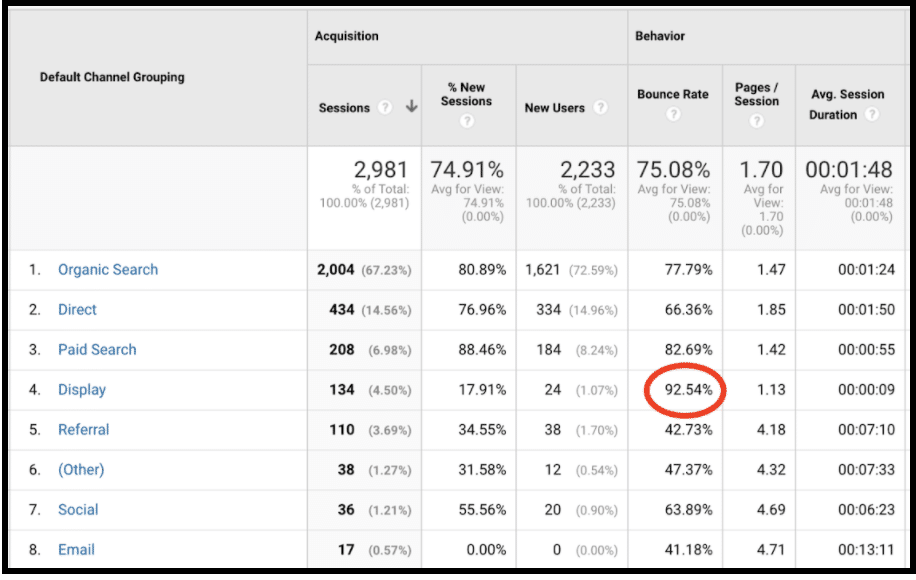
Bounce rate is a good indicator for this. High bounce rate can mean that you’re targeting the wrong audience or that your landing page is not relevant for them.
For example, here you can see that the traffic from display ads has an unusually high bounce rate and either the campaign or the landing page needs optimizing.
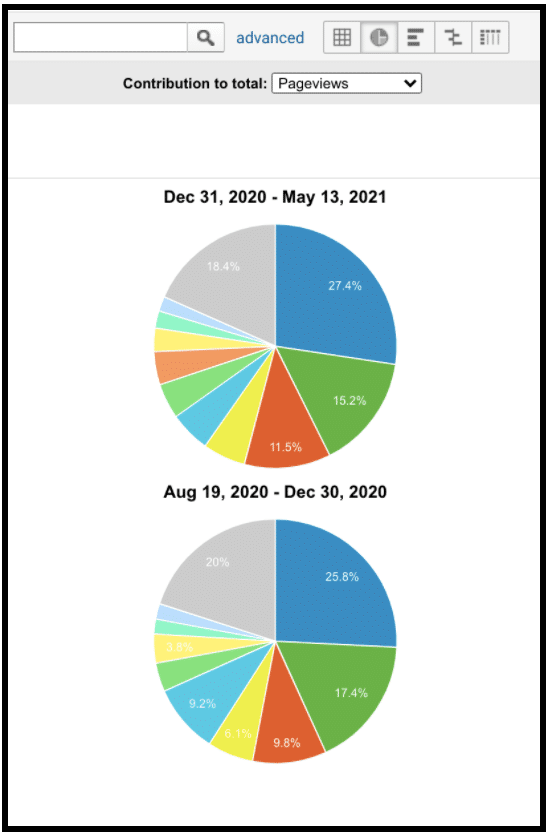
Acquisition reports can also give insights such as which content on your website needs optimization. Go to Acquisition -> Search Console -> Landing pages and compare the last year or six months with the previous same time period.
This way, you’ll be able to see if any of your previously successful content pieces has lost traffic and needs optimization. To get this data, you need to integrate your Google Search Console with your Google Analytics.
Also, you can use this same report to determine your most valuable content. Just select your most important goal and look at the conversion rates. You can then try to replicate the content that has the highest conversions and focus your SEO efforts on that page to get more exposure..
PRO TIP: If you see an unusual spike in your traffic, investigate the source in order to see if it’s artificial bot traffic. Set up alerts for unusual spikes or drops in your traffic to monitor the health of your site.
Google Analytics Behavior Report
Behavior report gives you deeper insight on which pages are performing well and which aren’t. Content section drills down into the user experience on the page and behavior flow maps out the customer journeys.
Low bounce rate and high average time on page are generally good metrics to measure content performance.
In content drilldown, you can also look at your website grouped by the directory structure. It also allows you to see which areas of your website are most popular and whether there’s any changes over time.
In the behavior report, you can also monitor the site search results and events that you set up earlier.
Google Analytics Conversions Report
Conversions report mainly focuses on the goals that you set earlier.
The report shows you the total amount of goal completions and how they split between different goals. You can also look into each goal specifically.
Google Analytics always credits the last landing page the user visited for the conversion.
This fails to take into account that the buyer’s journey is often much longer than just one website visit. Especially with B2B conversions, it might take several weeks and multiple visits to the website and engaging with different content before the conversion finally happens.
So how do you measure the content pages that assisted the conversions?
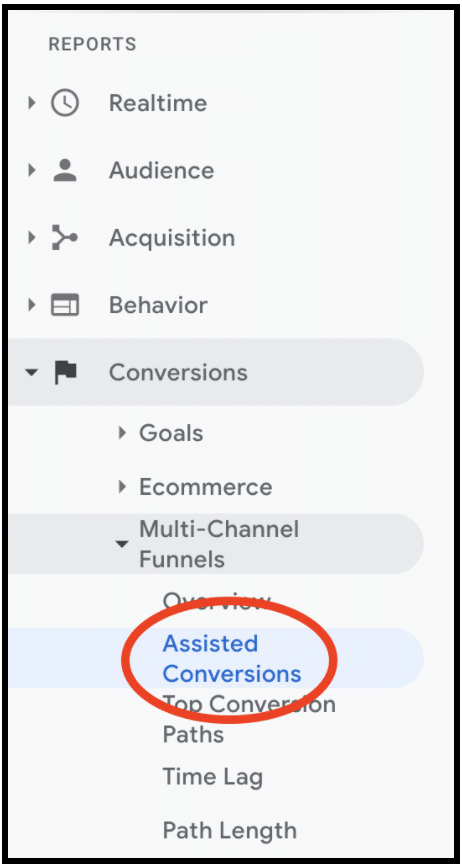
Go to Conversions > Multi-Channel Funnels > Assisted Conversions.
However, in order to accurately measure this, you need to know the average length of the sales cycle of your business and fill in the information in GA.
Wrapping Up
Now you should have a good understanding of the Google Analytics basics: Why it’s important, how to set it up properly and how to read your Google Analytics data.
Once you master the basics, start looking at more granular data. One filter, segment, and secondary dimension at a time, you’ll begin gaining more accurate insights into your marketing success.
The more specific information you’re able to get from your campaigns, the more you’ll be able to use that data to grow your business and predict the future.


